This week there has been a certain amount of hopping around about child poverty. UNICEF, the UN body for children, came out with a report that placed the UK at the bottom of a table of 43 wealthy countries, showing the biggest rise in child poverty – 20%. It is misleading. Or at least it is in terms of the UK debate.
For the whole length of time that the Conservatives have been in power there have been predictions of growing child poverty. These never come true, or at least not at any scale. The reason they never quite come true is that the favourite measure of child poverty is the largest. That metric is percentage of children living in households with less than 60% of median income after housing costs. Relative CP AFC for short. Part of the DWP’s Households Below Average Income dataset. The percentages can be found at Table 1.4a.

Relative child poverty (after housing costs) has wandered around 30% for the whole of this century so far. This is a big number, but most of its change can be attributed to movements in the overall economy. So, after the global financial crisis child poverty fell, strangely, in the face of austerity. Why? Because government workers fell in number (and they are often highly paid) and private wages fell, but benefits kept their real terms value, hence relative child poverty fell. Or at least the median household income moved down relatively making fewer children “poor”. Since then as public sector employment has risen with Covid and wages have started to rise, child poverty has risen again slightly. Notably though, it has only got back to where it was when New Labour left power.
The UNICEF report does look bad as it shows the UK increasing child poverty by 20%. This is a source of dismay. There are two caveats though. Firstly, the measure they used was the before housing costs one. No-one uses this in the UK. If I was being cynical it is because this number is typically 20% so it doesn’t sound quite so harrowing when you say 1/5th of children in poverty rather than 1/3rd. But mainly it isn’t used because we all live after housing cost lives. The after housing costs measure only rose by 6.8% in the seven year window UNICEF used. This is a much smaller rise and very similar to other very wealthy countries like ourselves.
It is dishonest and misleading to consistently cite 30% child poverty then switch metric to steal the rise in another metric that you never use because it is always smaller.
The other caveat is that this metric fell by 20% in the previous 7 year period so it has merely returned to its starting point. As is so often the case, we are served bad news but not the good. When did you hear about the 20% fall in child poverty “under the Tories”?
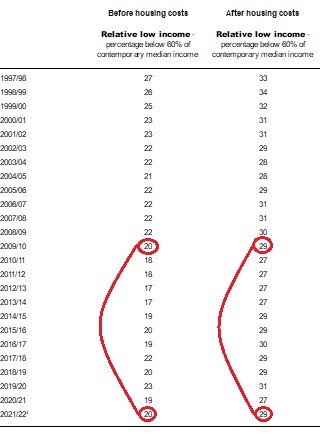
At the end of the New Labour period relative CP BHC was 19.98% in 2009/10. The latest figure available for 2021/22 is 20.01%.
At the end of the New Labour period relative CP AHC was 29.38% in 2009/10. The latest figure available for 2021/22 is 29.17%.
So, after 12 years of Conservative government the BHC measure is a tiny fraction worse (higher), 0.03 percentage points. The AHC measure is a bit better (lower), 0.21 percentage points.
For the 13 years of New Labour these measures were worse on average than the years since. There was only one New Labour year when the BFC measure was better than the last available data point. There were only 2 years when the AFC measure was better than the last available data point. Even if you take out Labour’s first 5 years on the basis that they were a hangover from the previous government New Labour still underperforms. In spite of dealing with austerity and Covid the Conservatives have a better record on child poverty than New Labour.